
Power BI dashboards by category
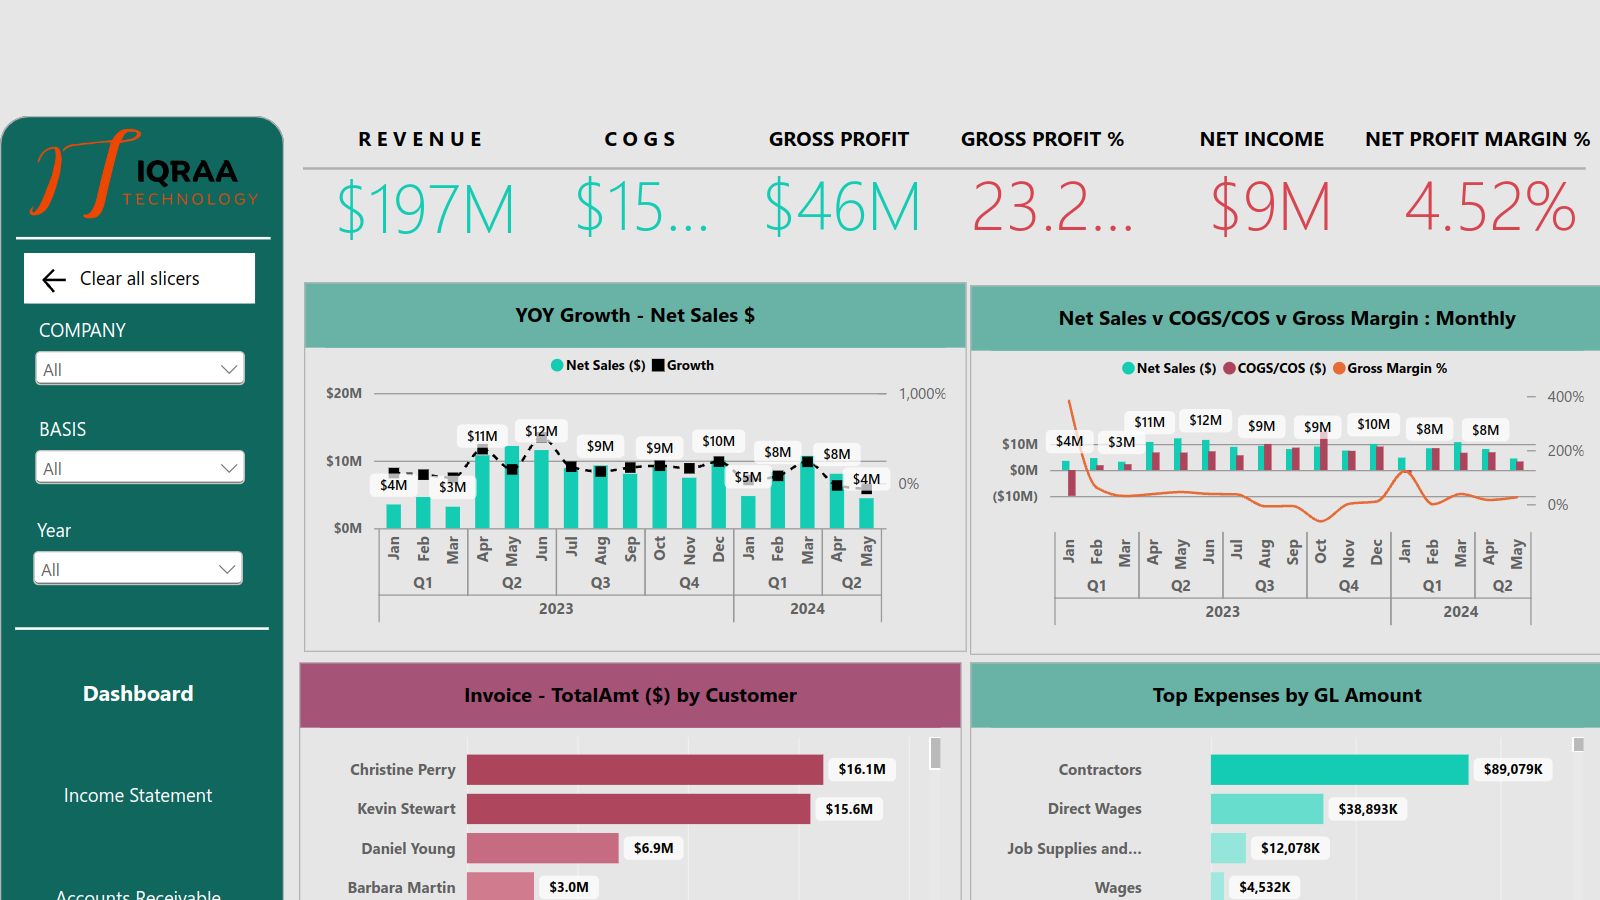
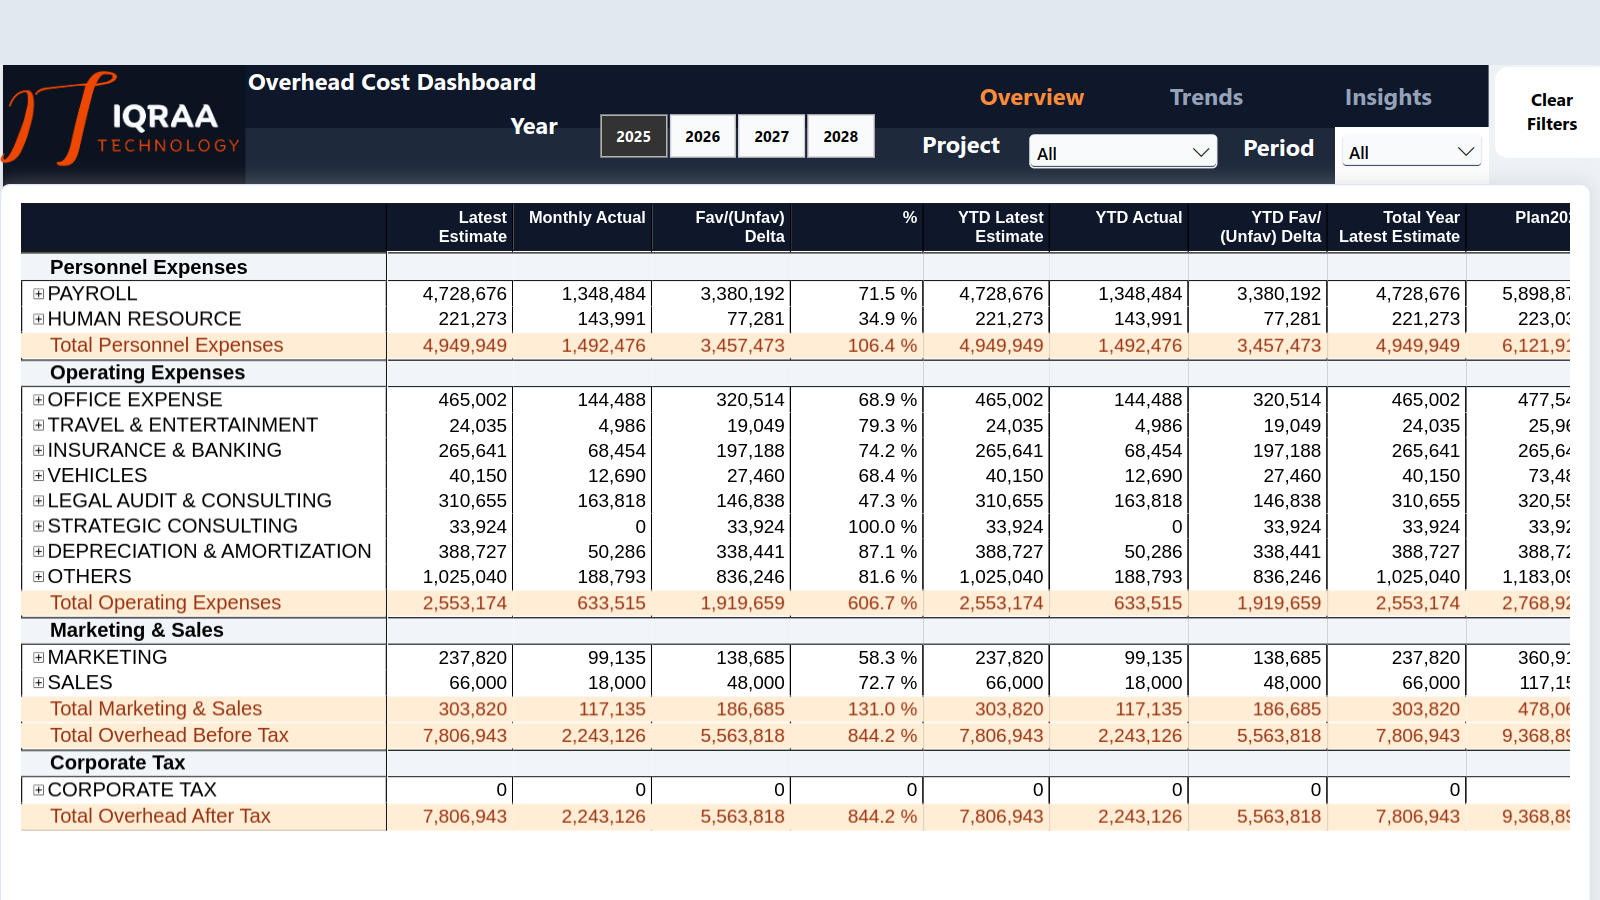
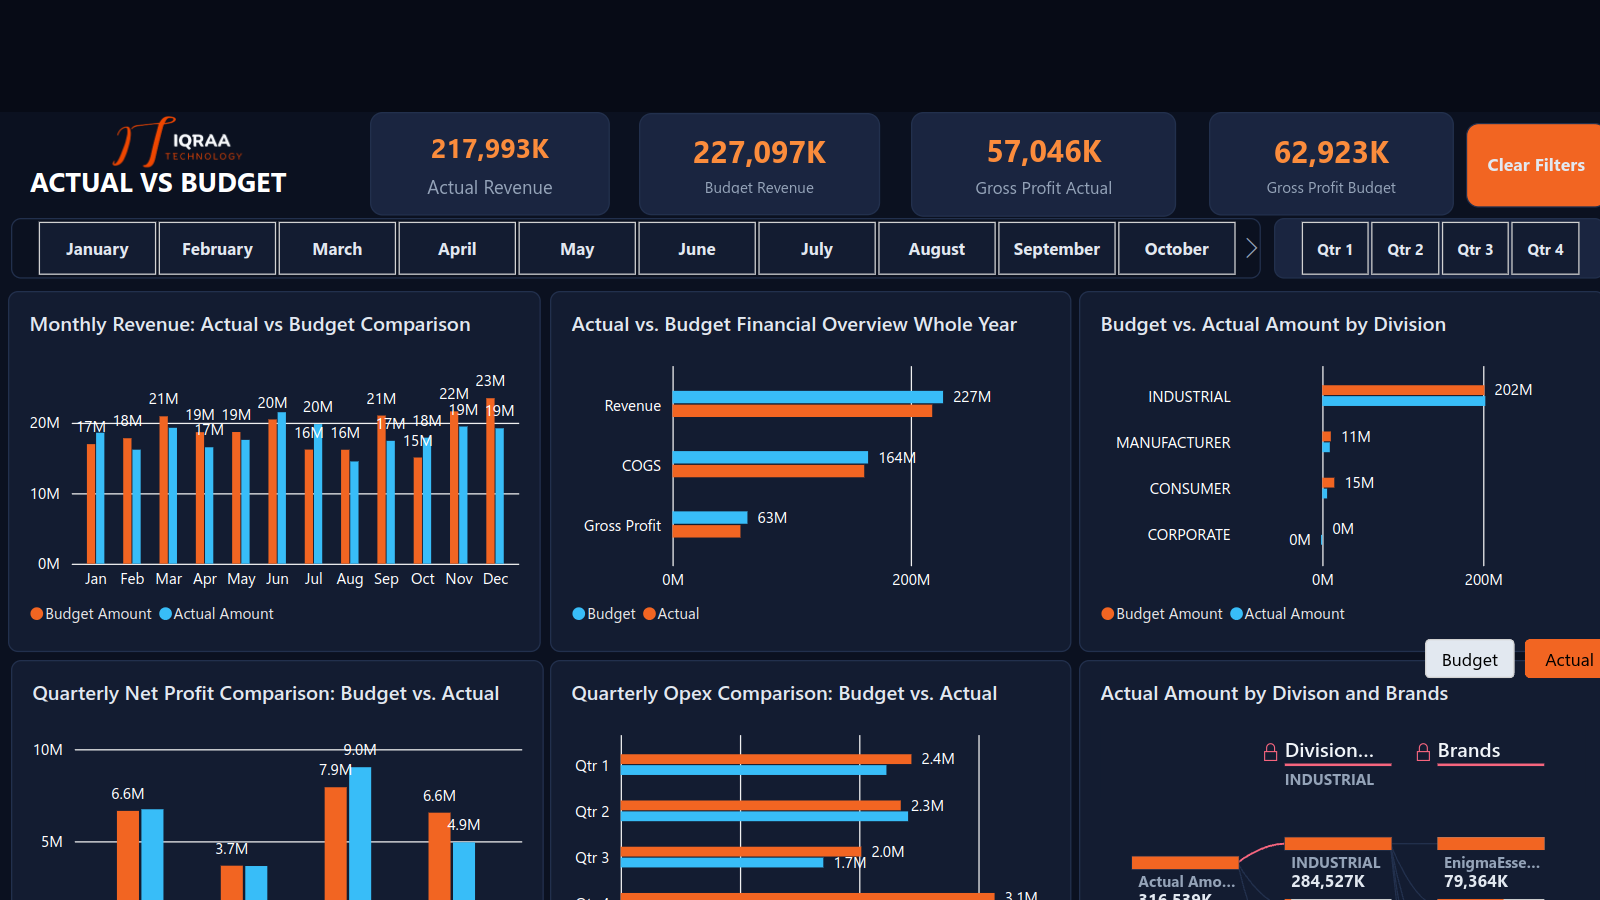
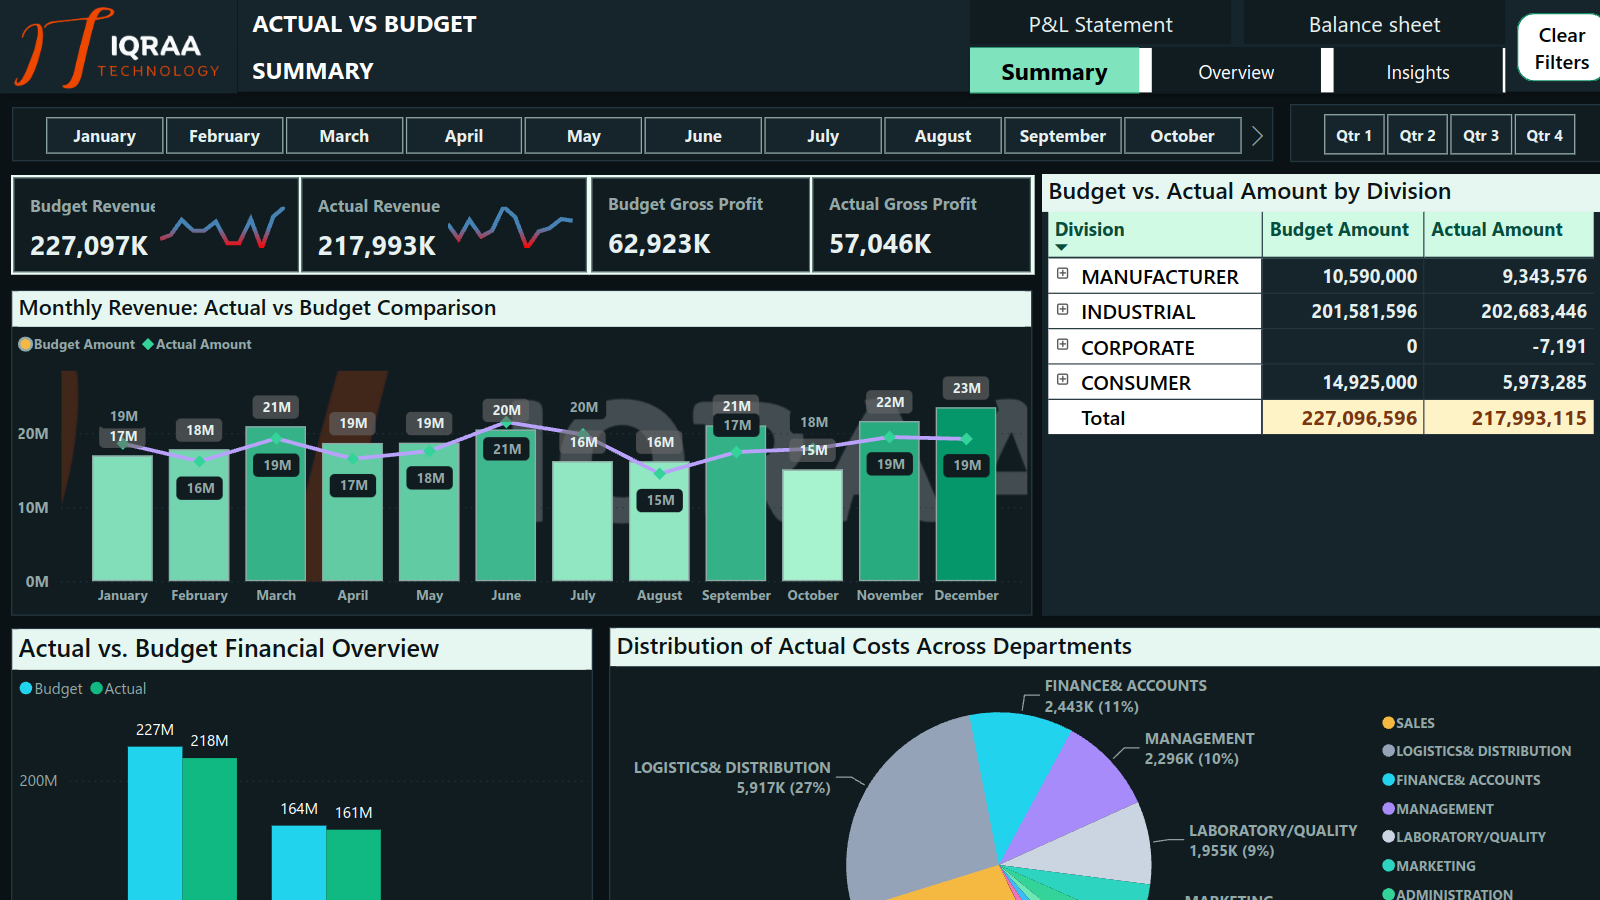
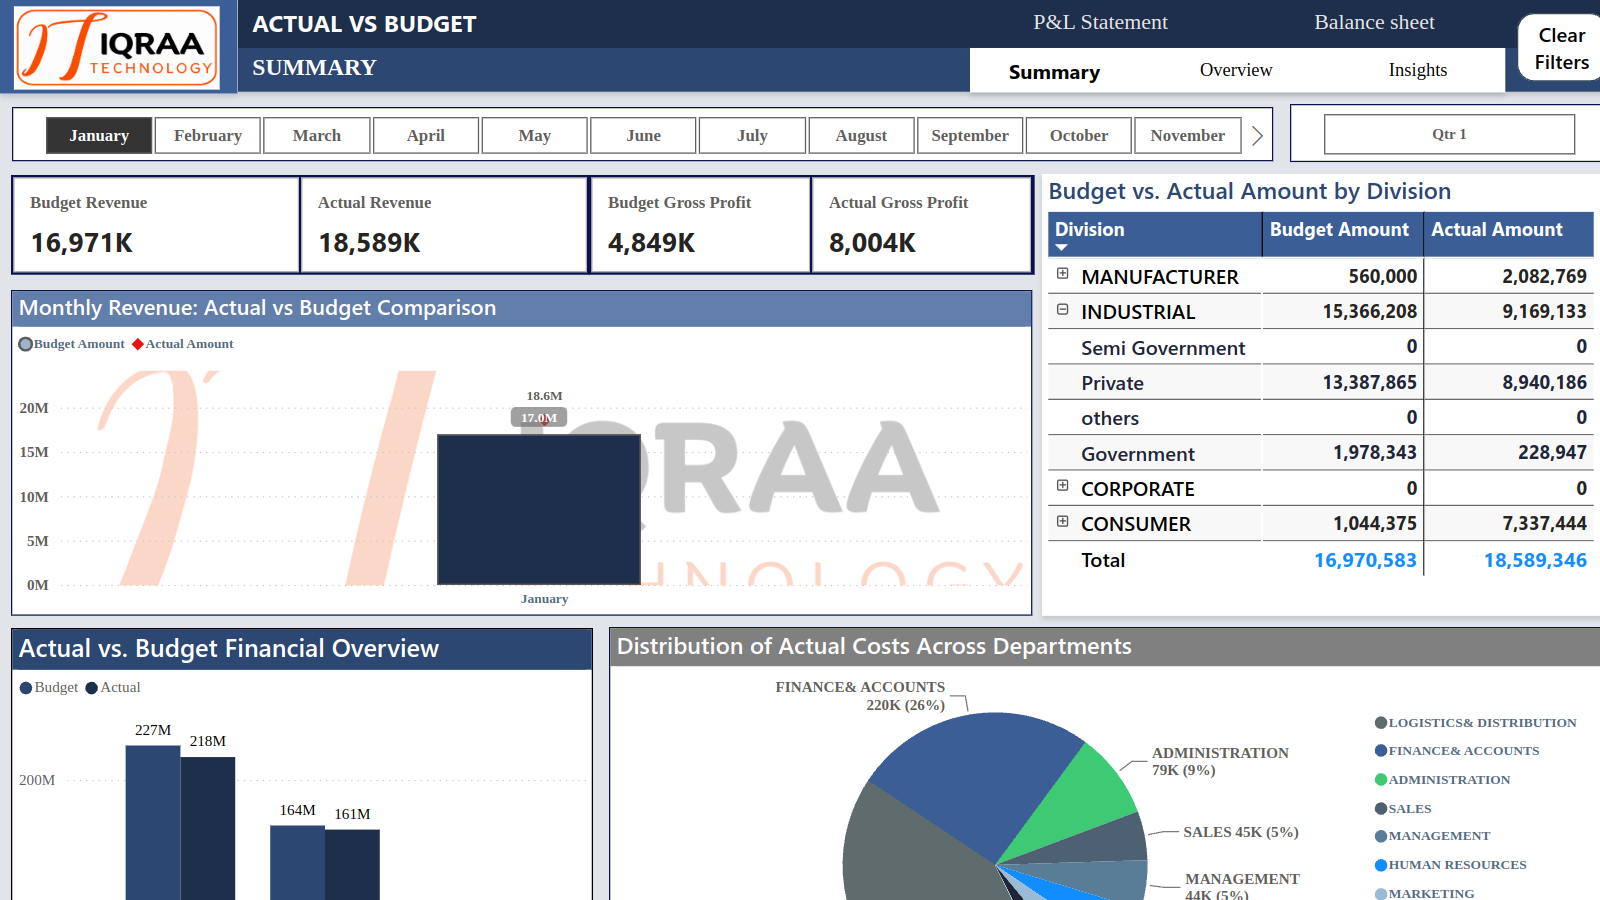
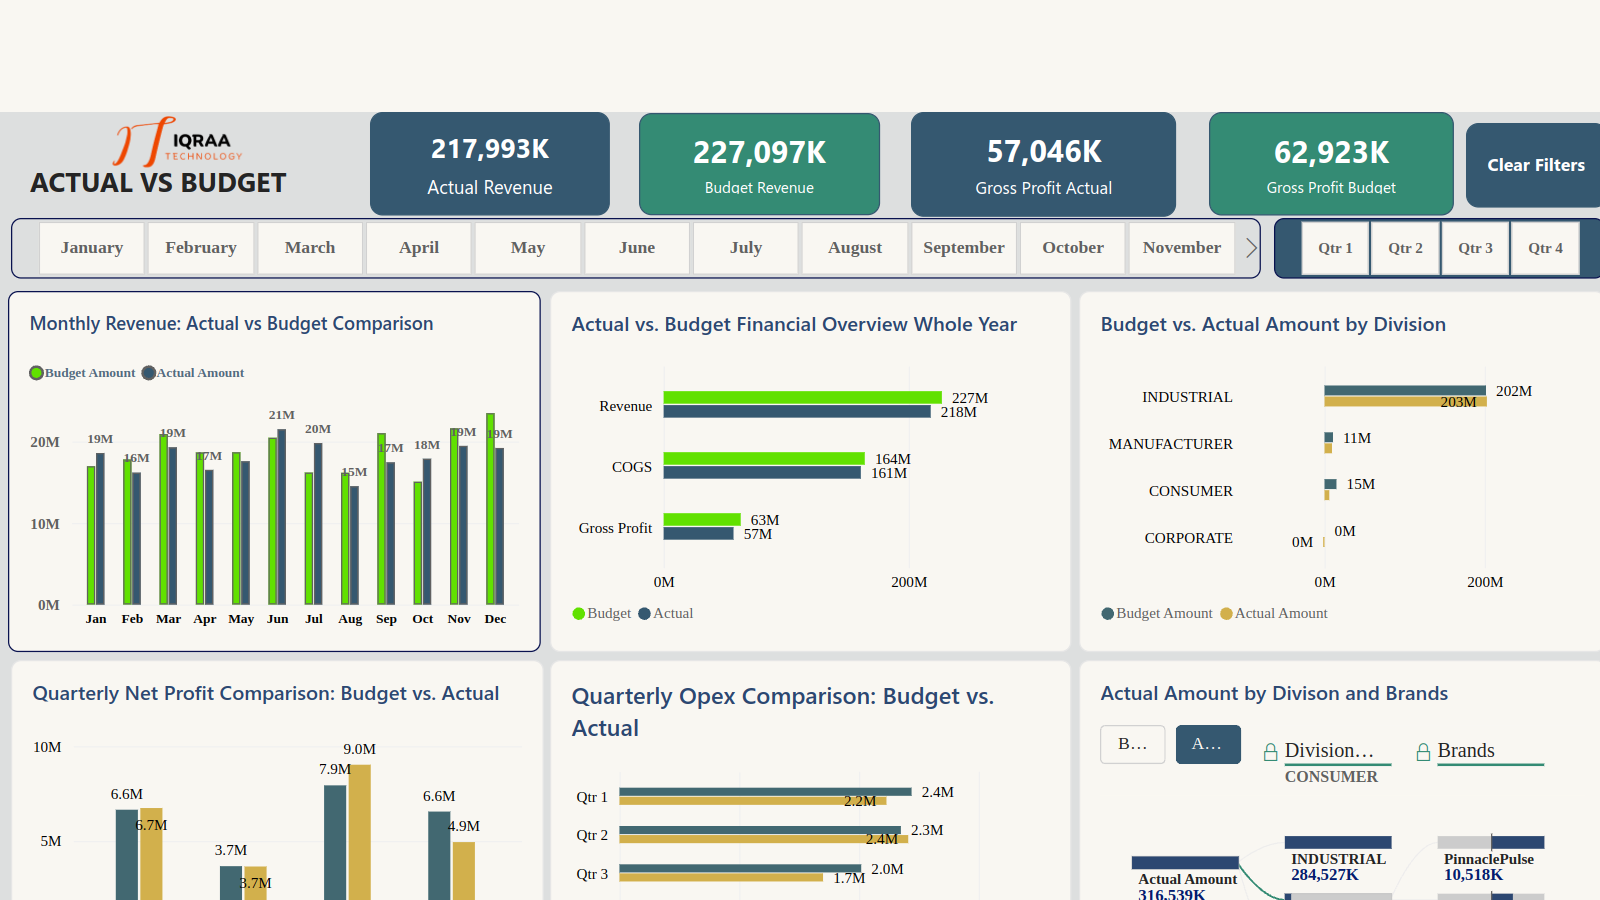
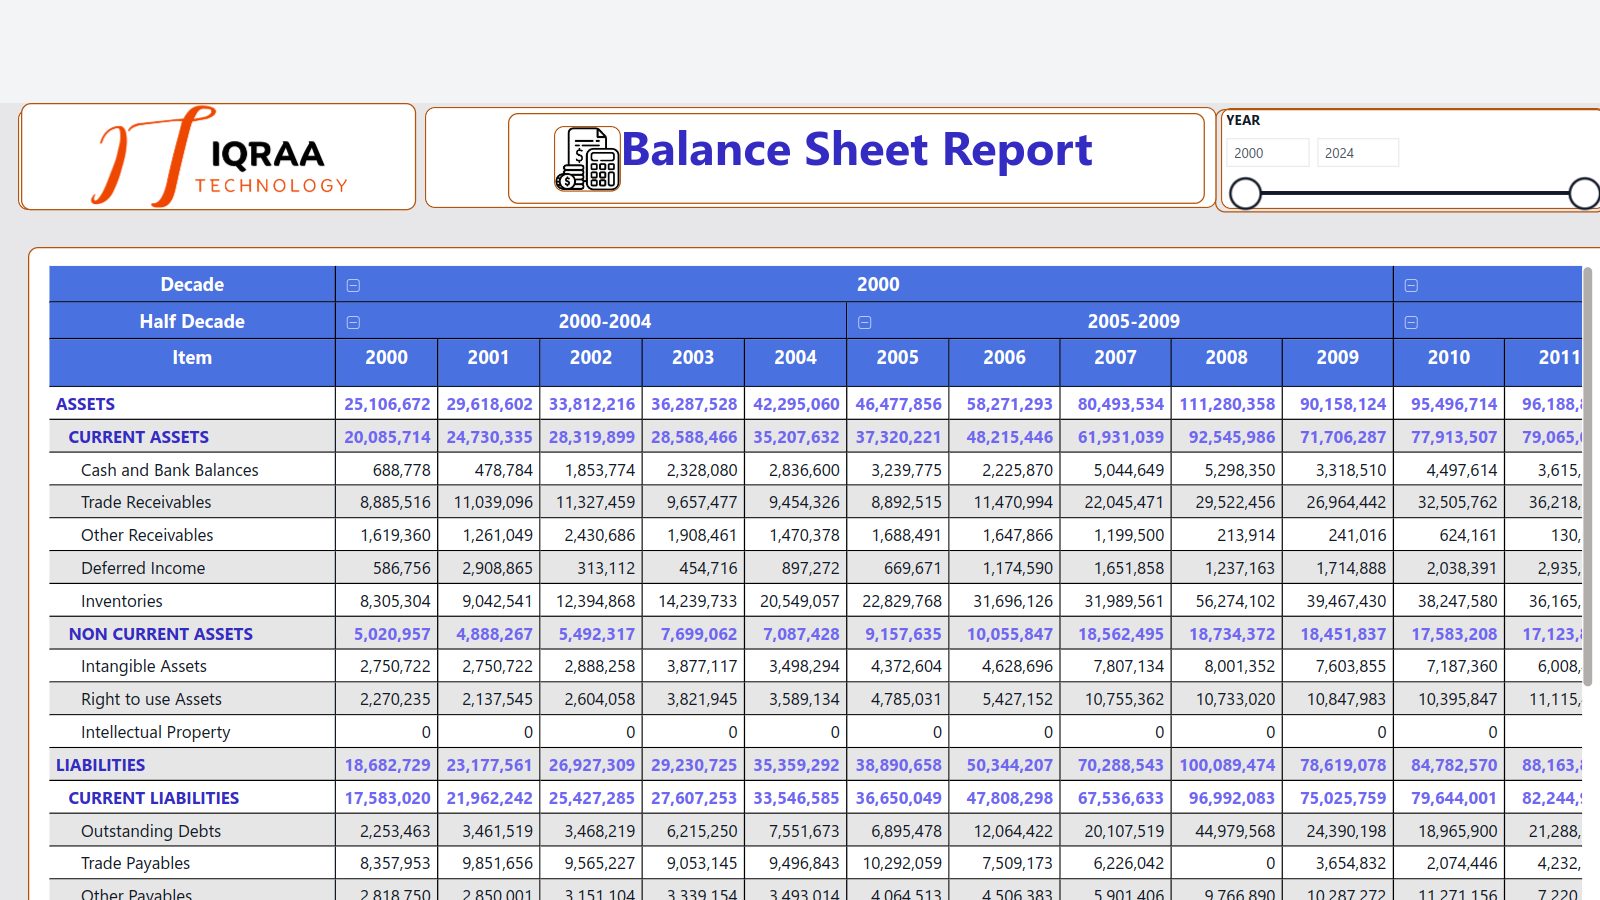
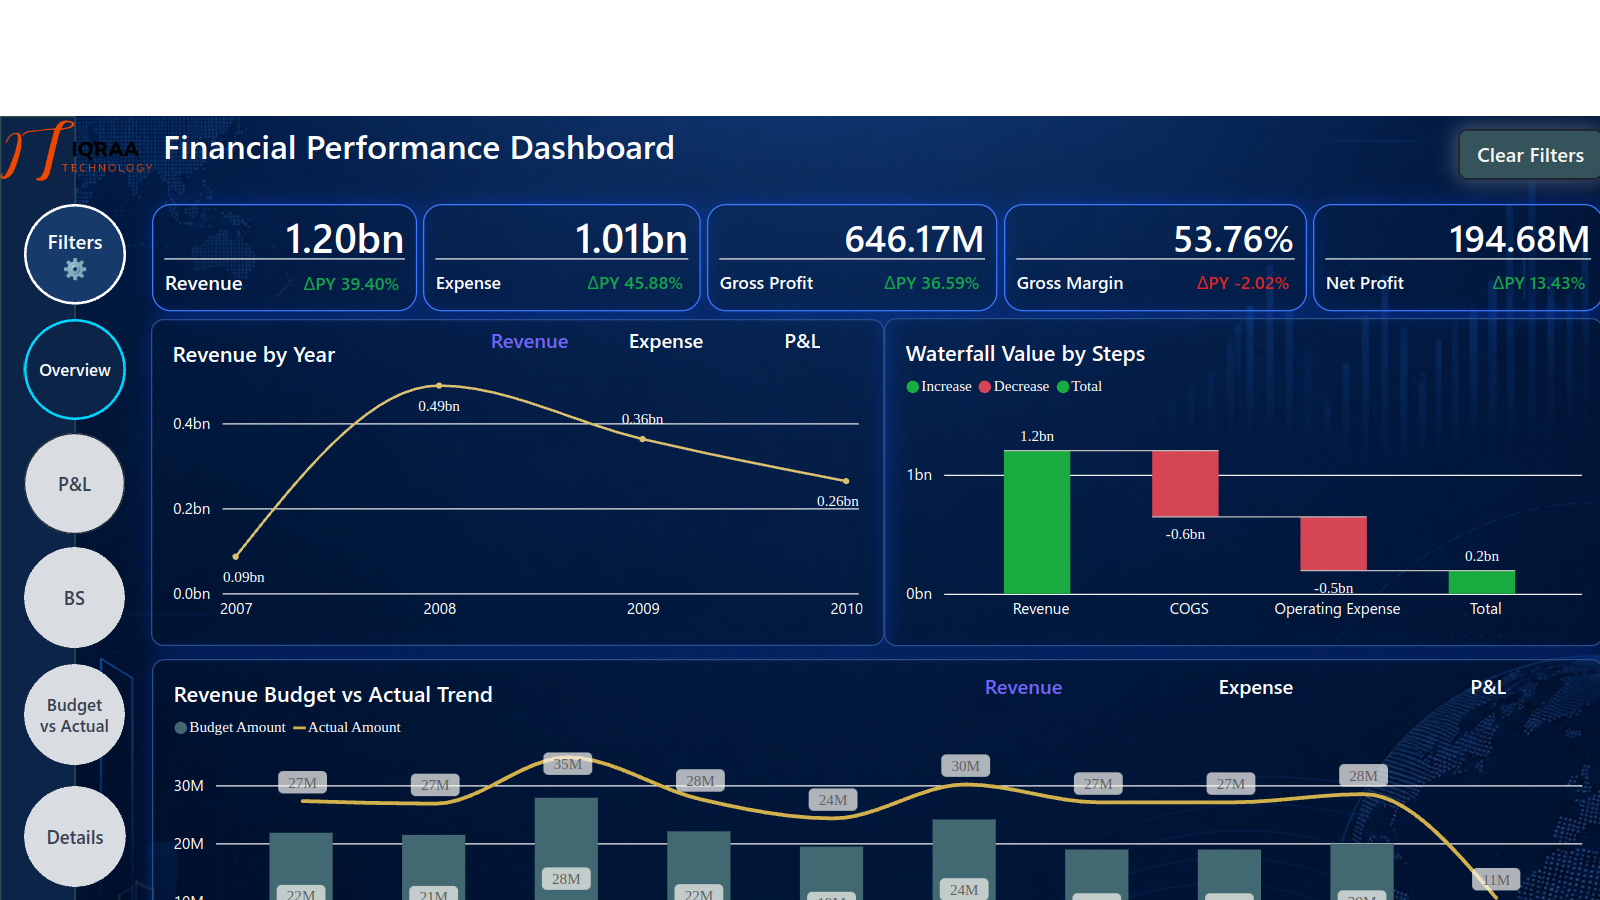
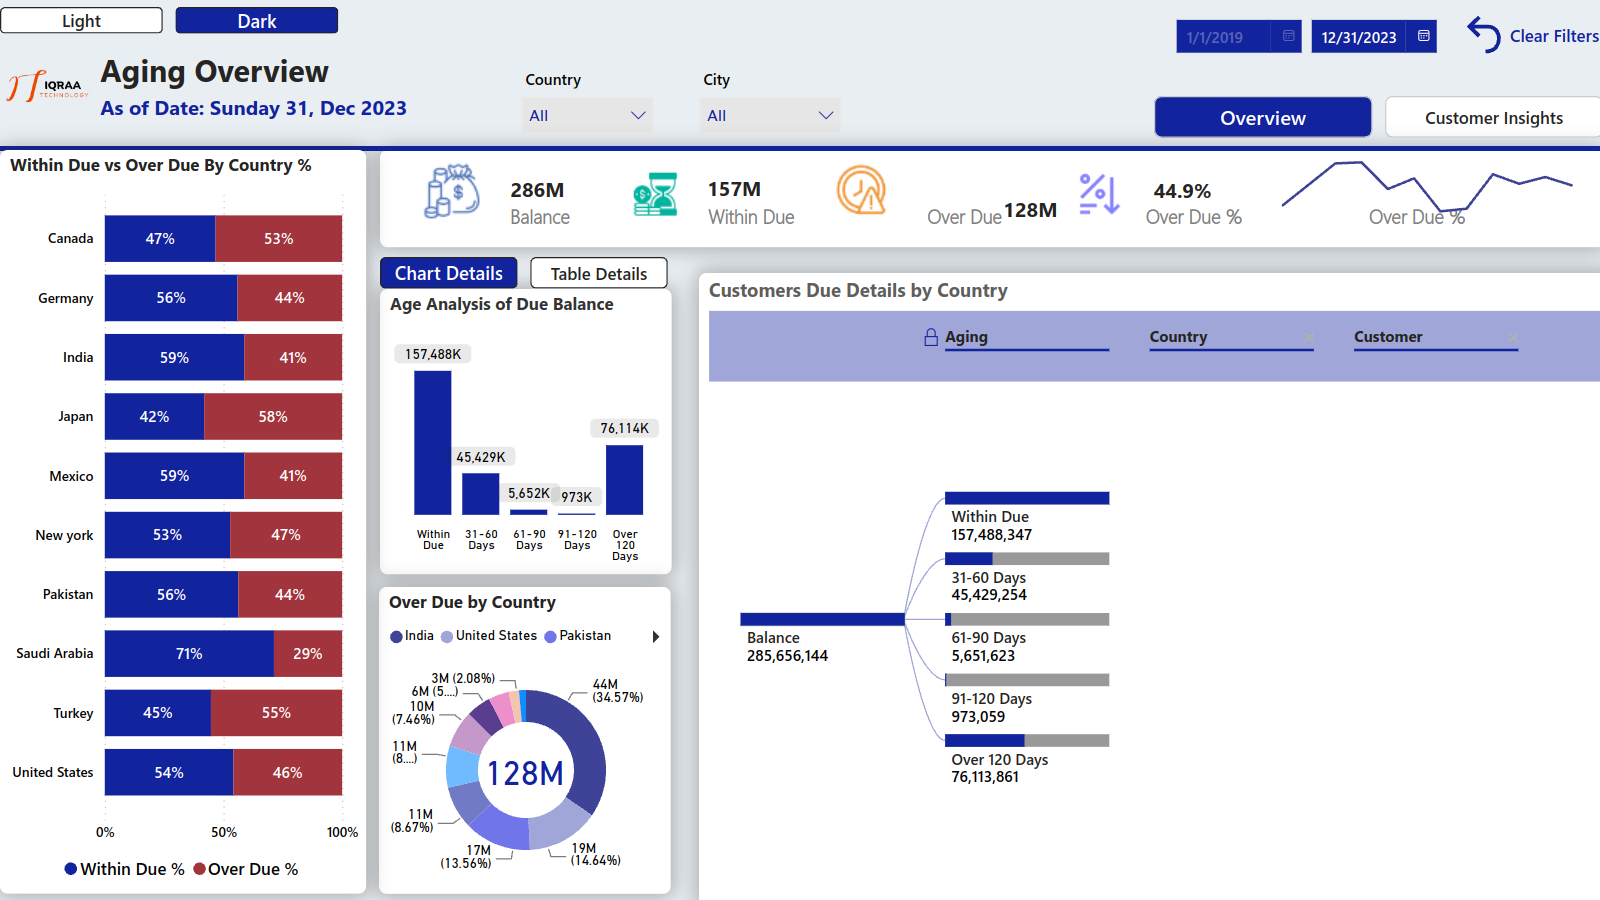
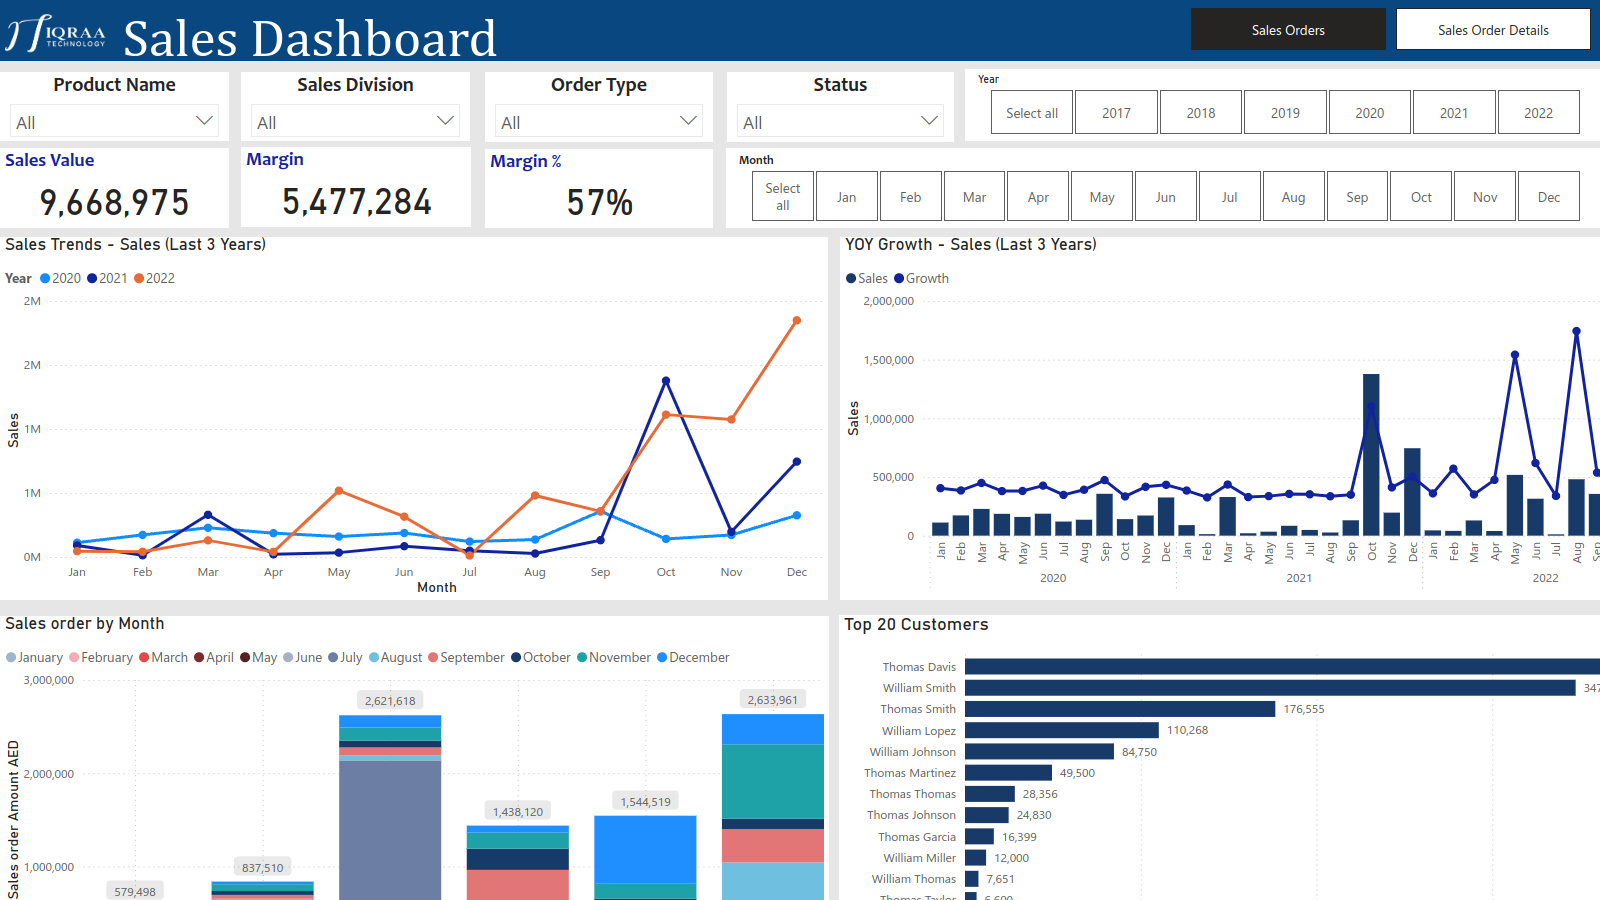
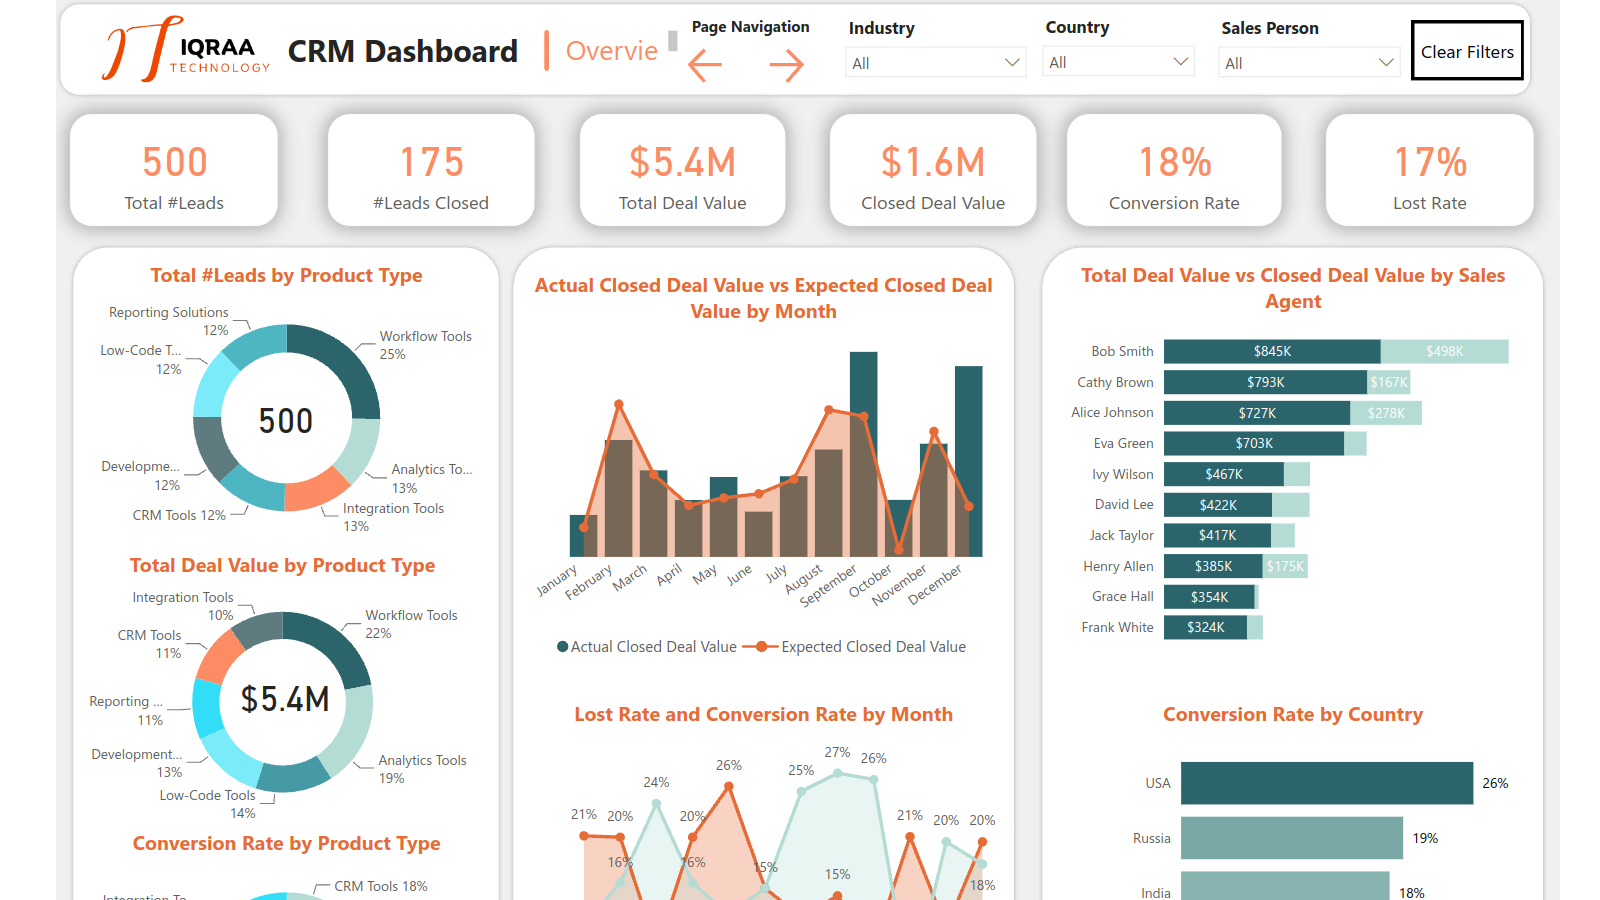
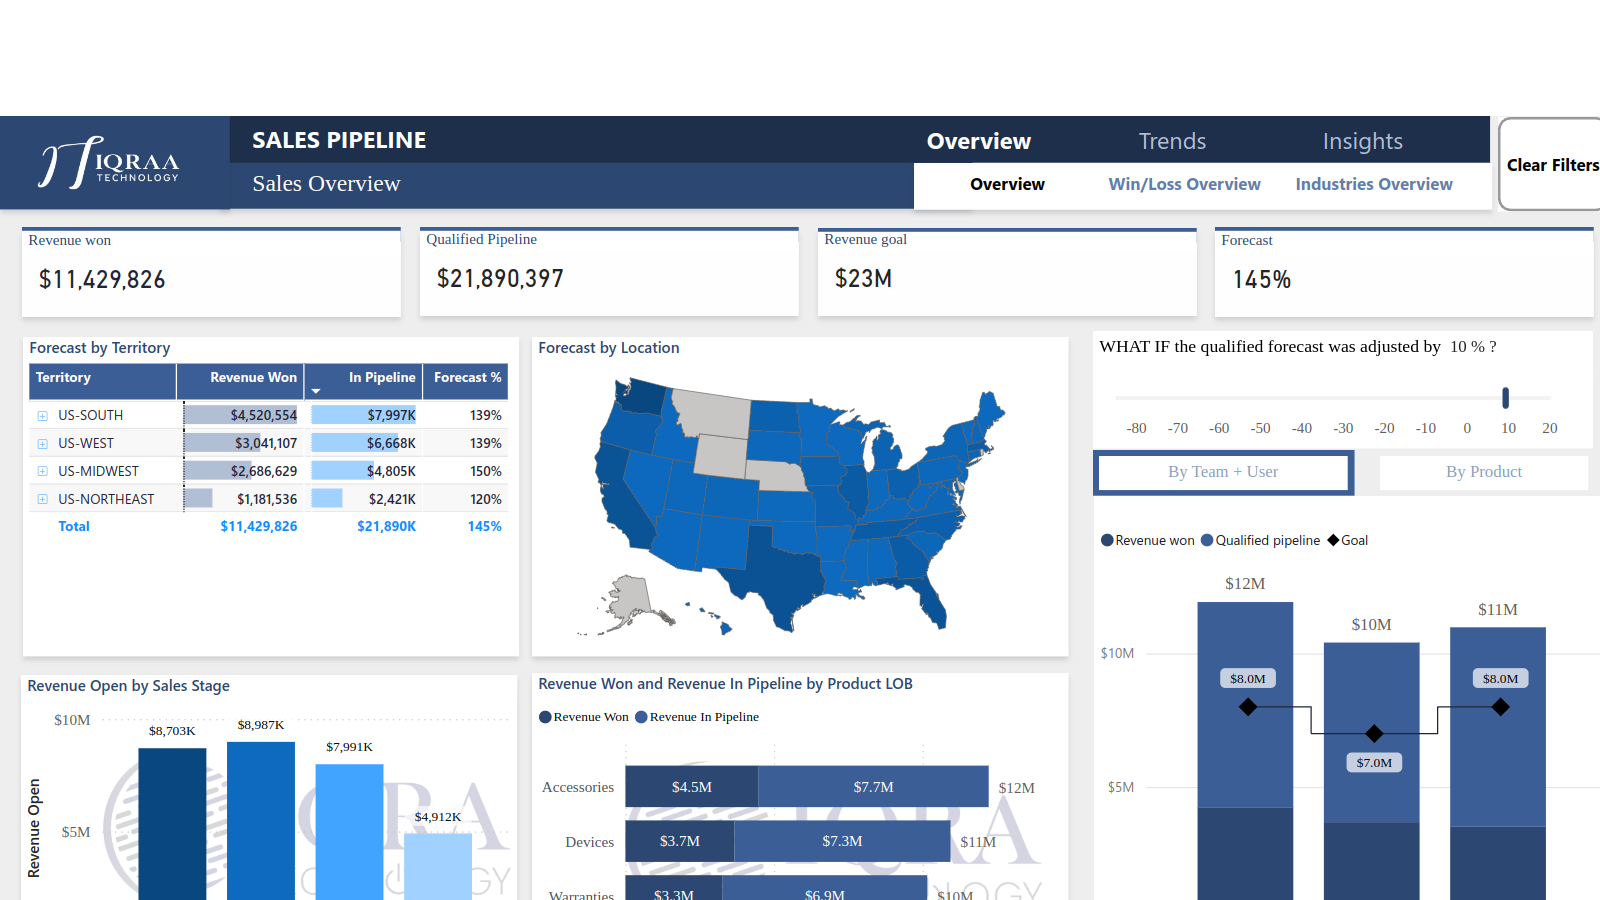
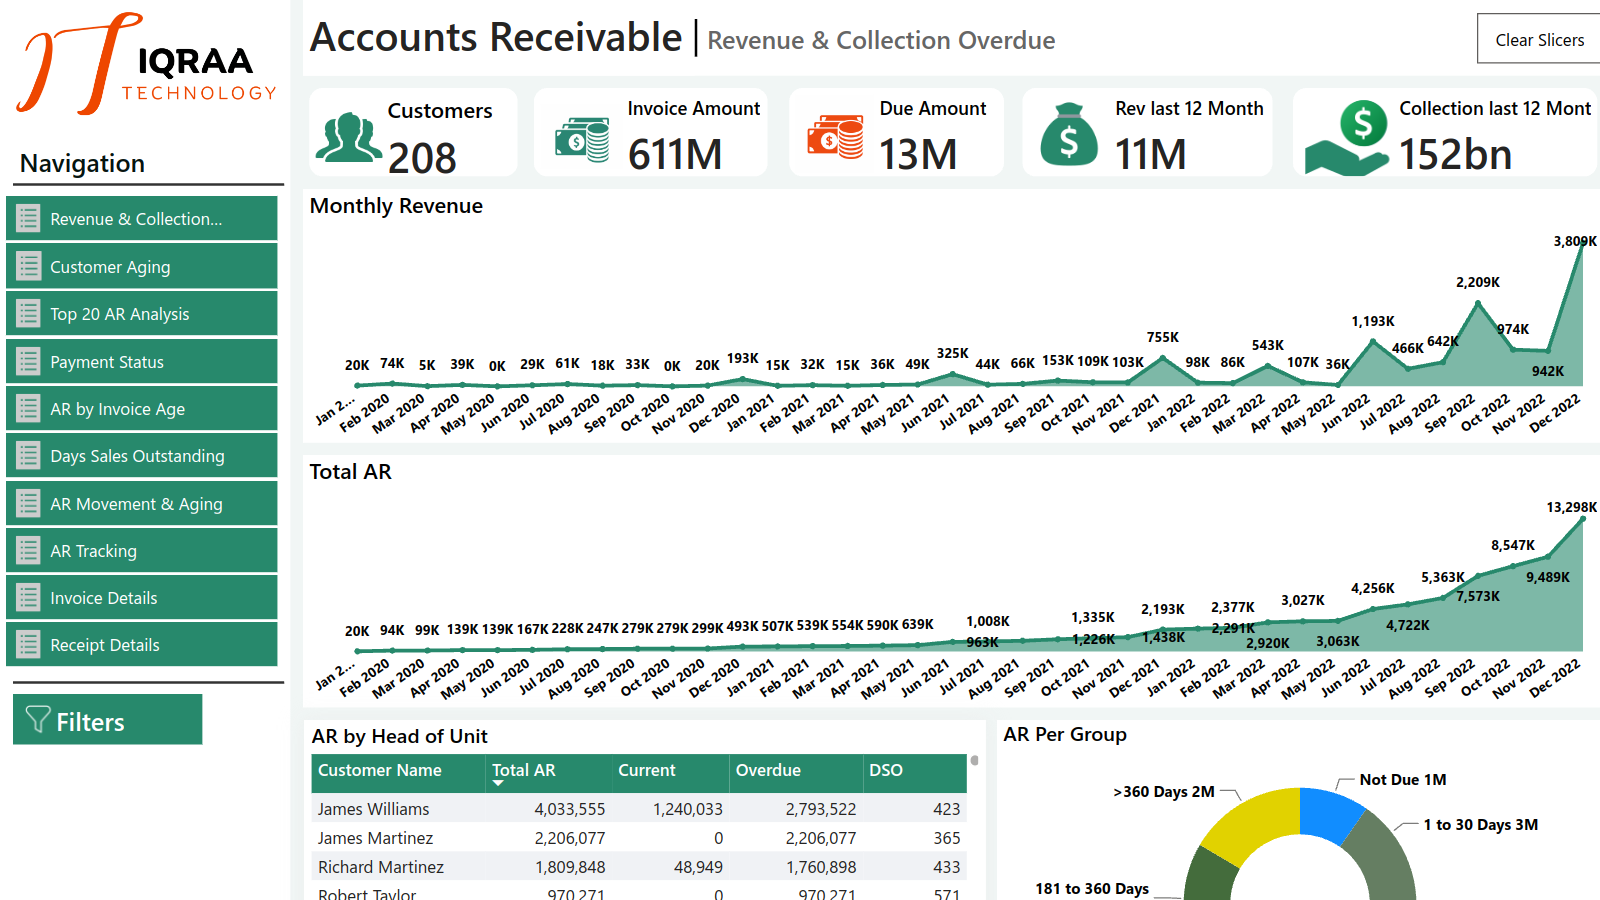
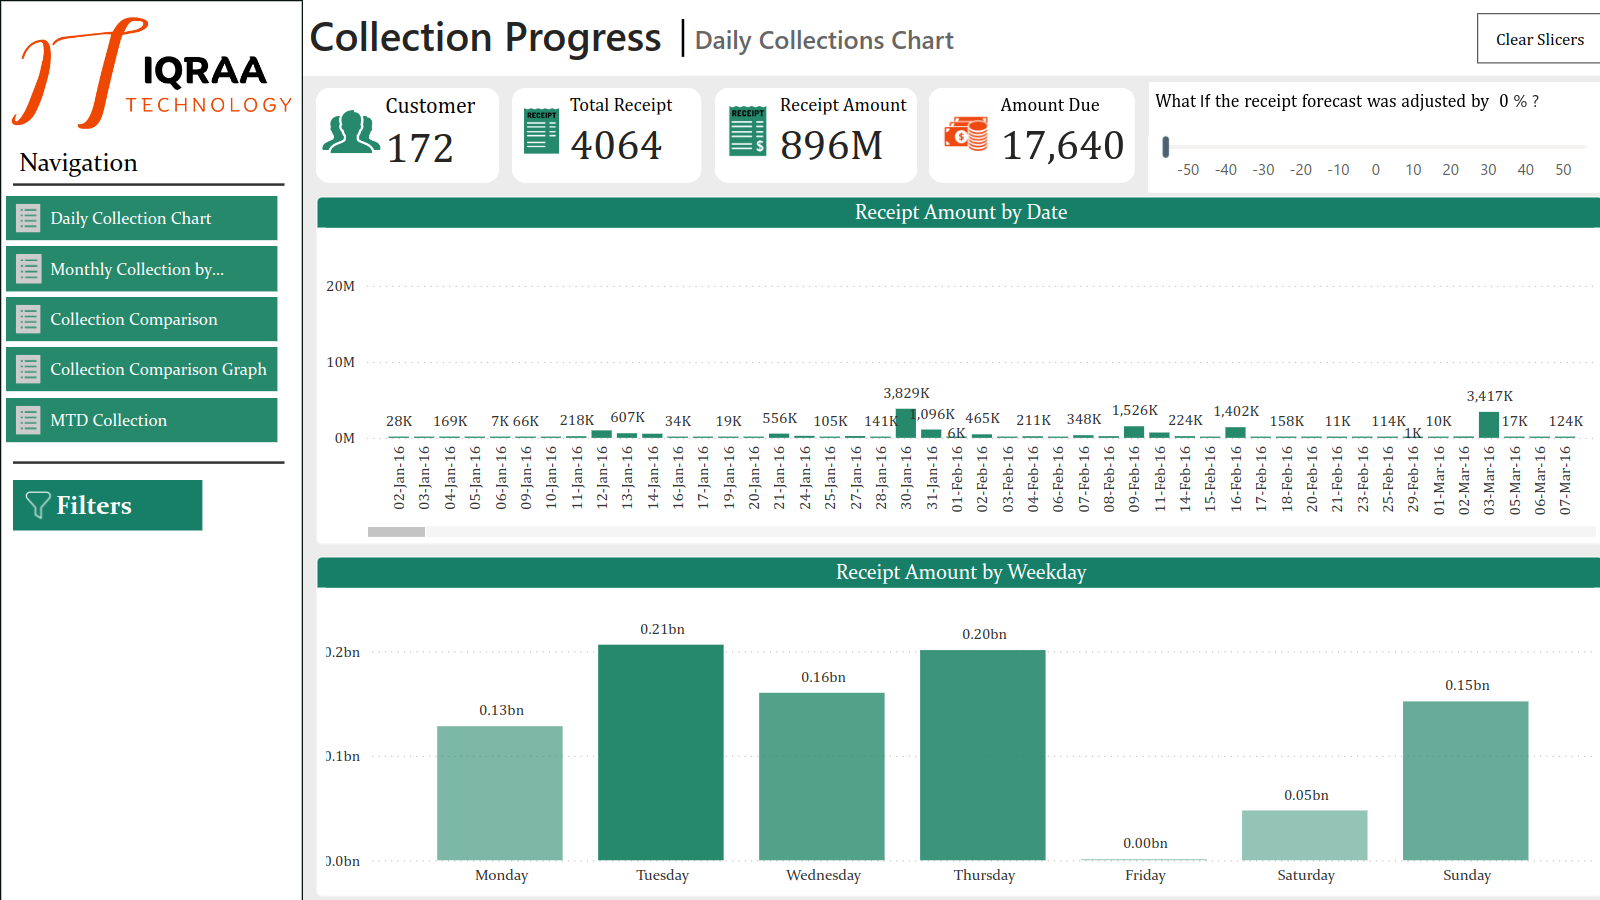
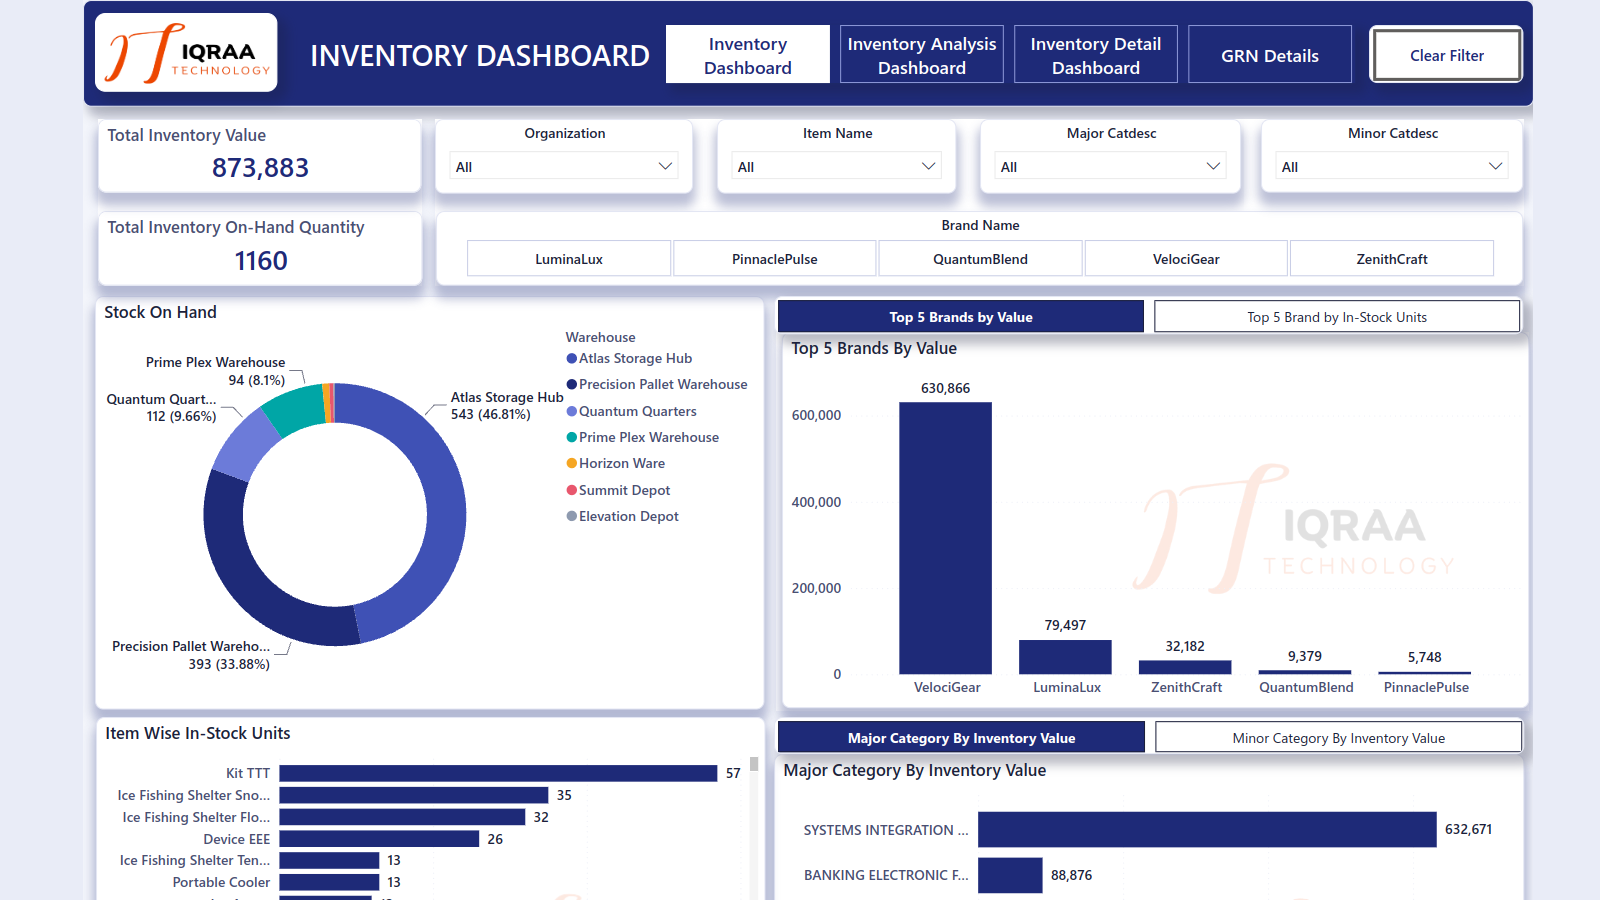
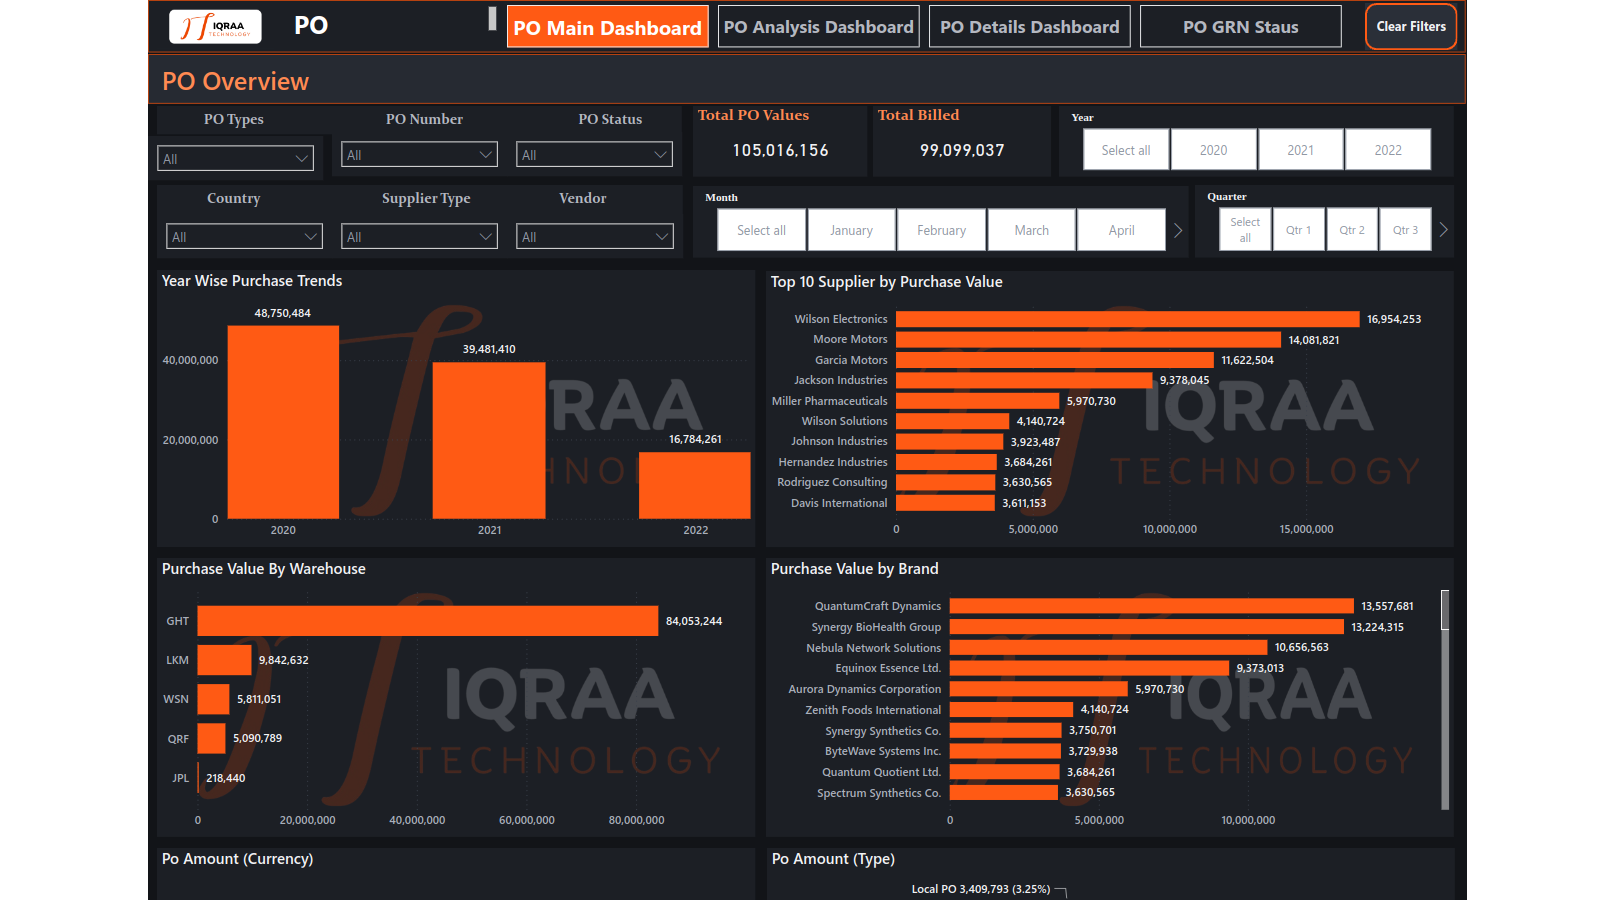
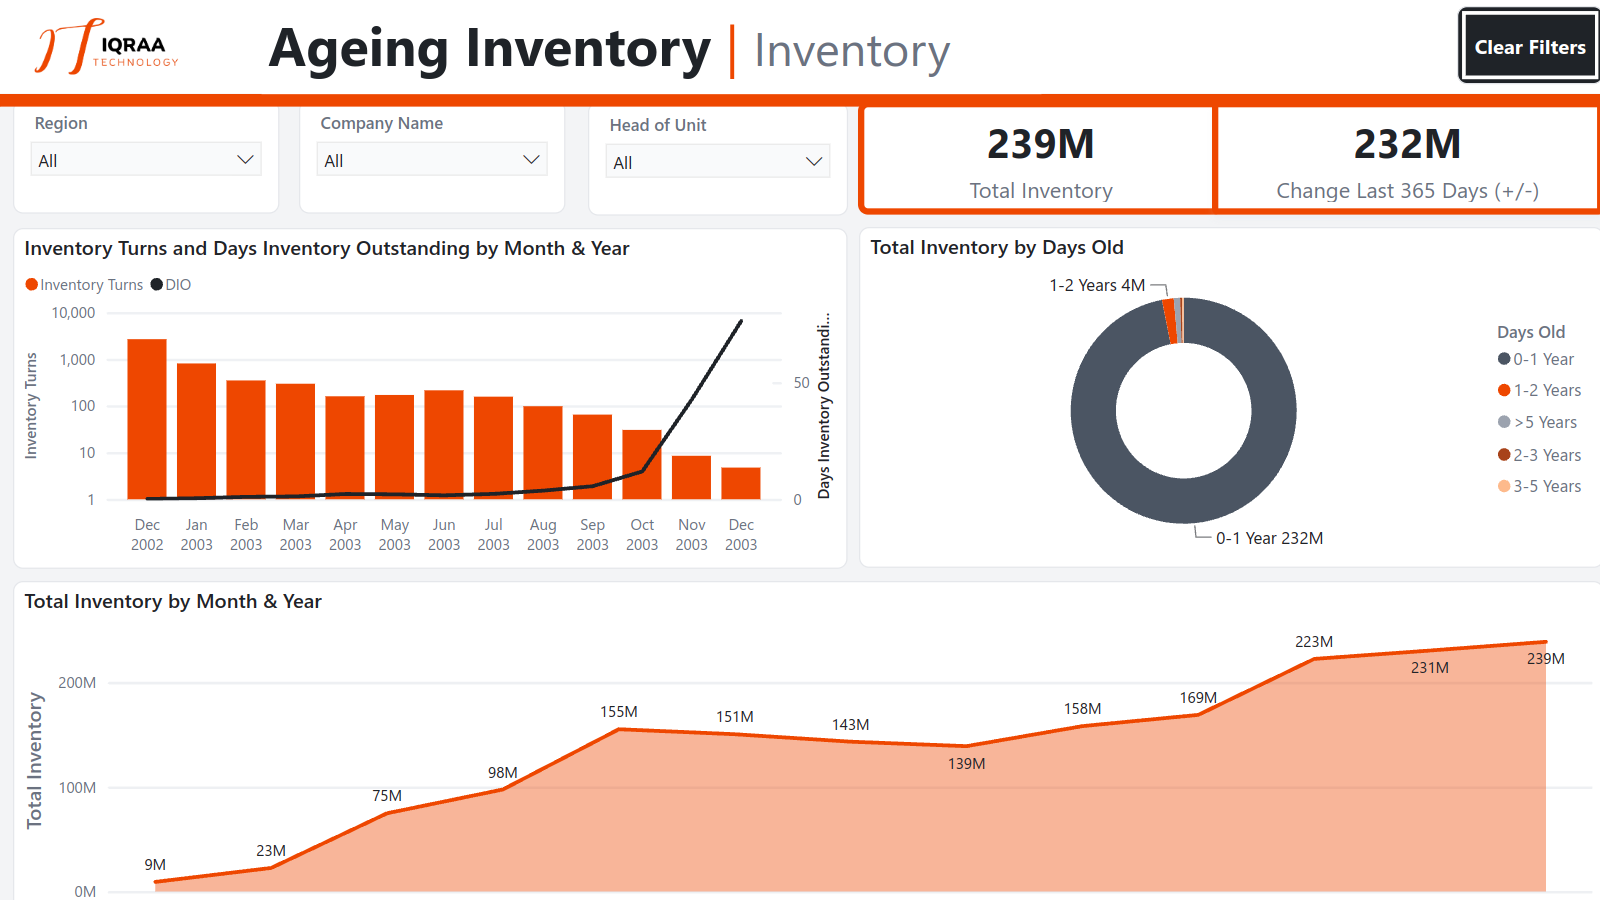
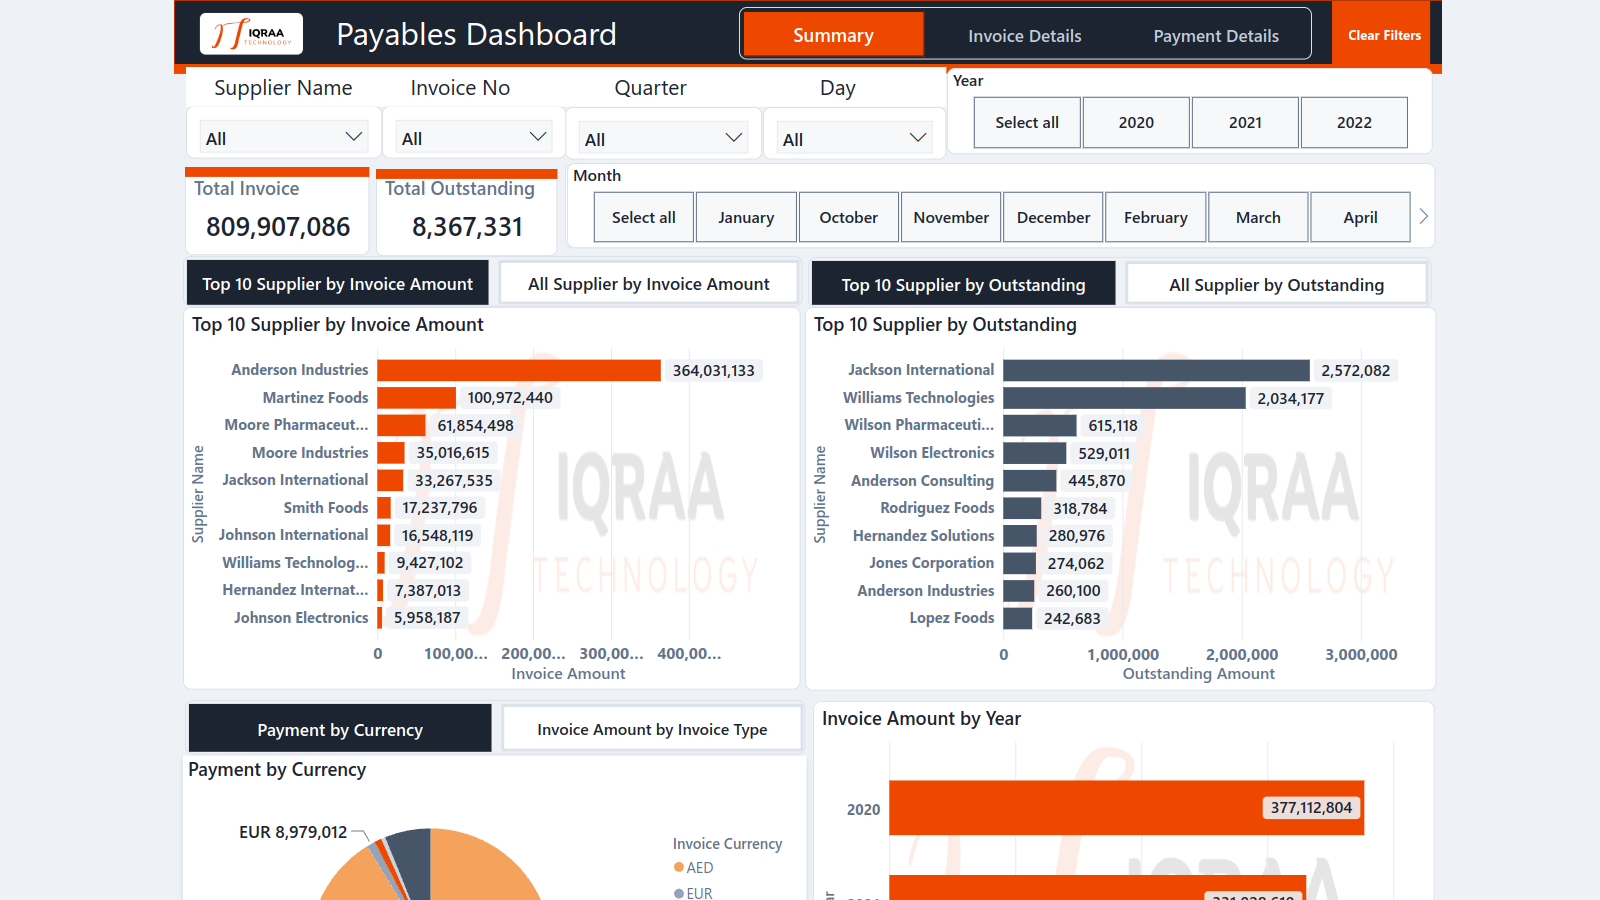
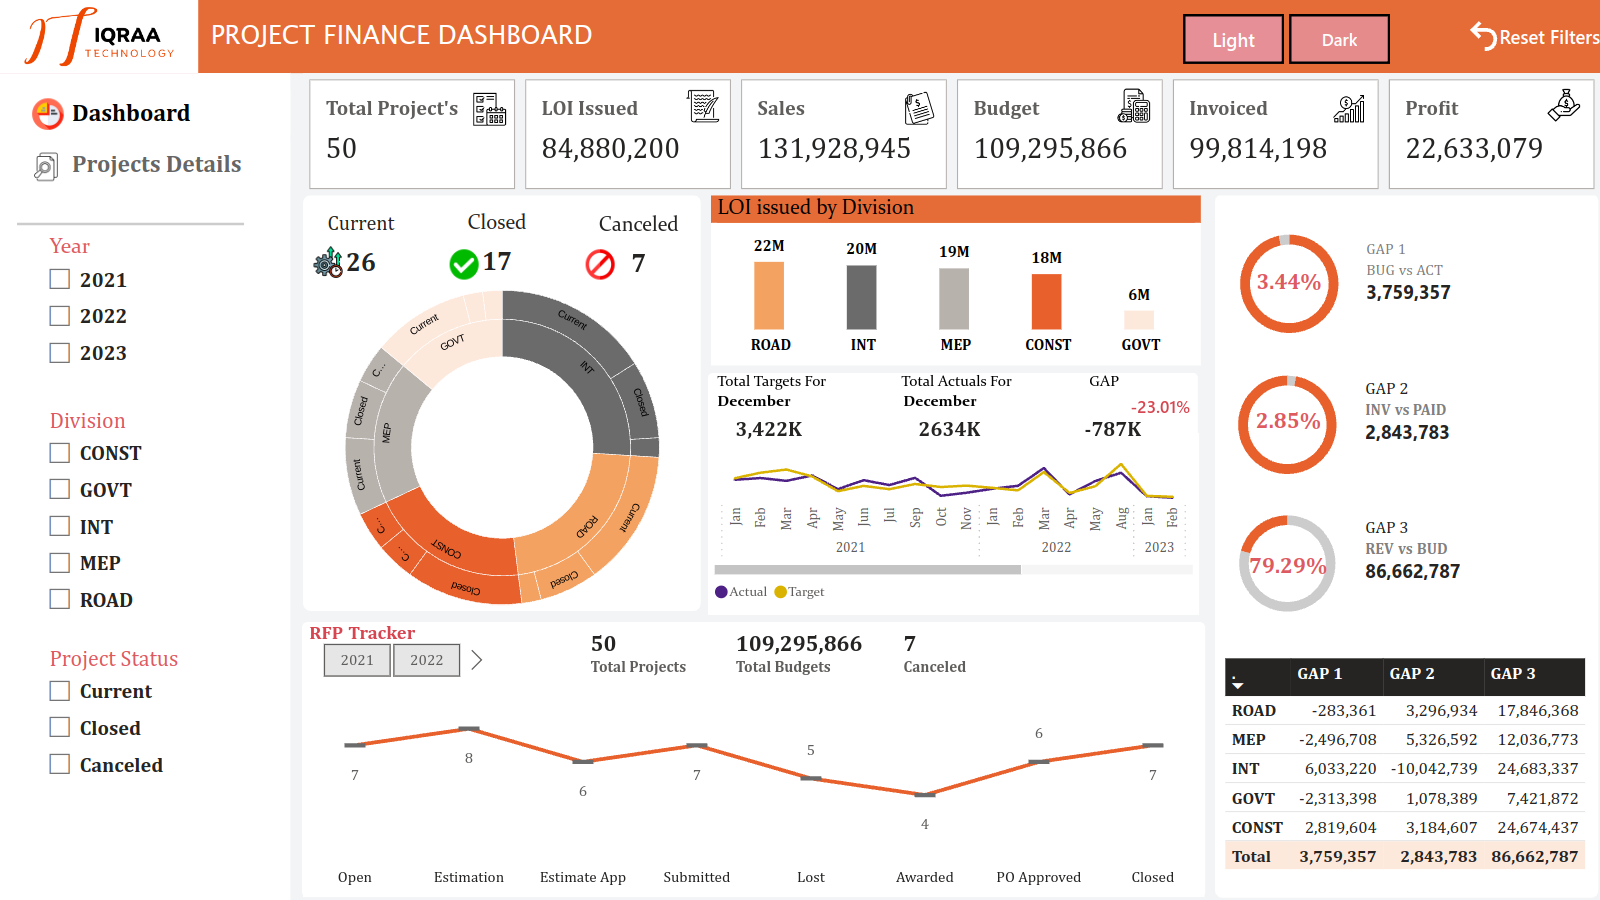
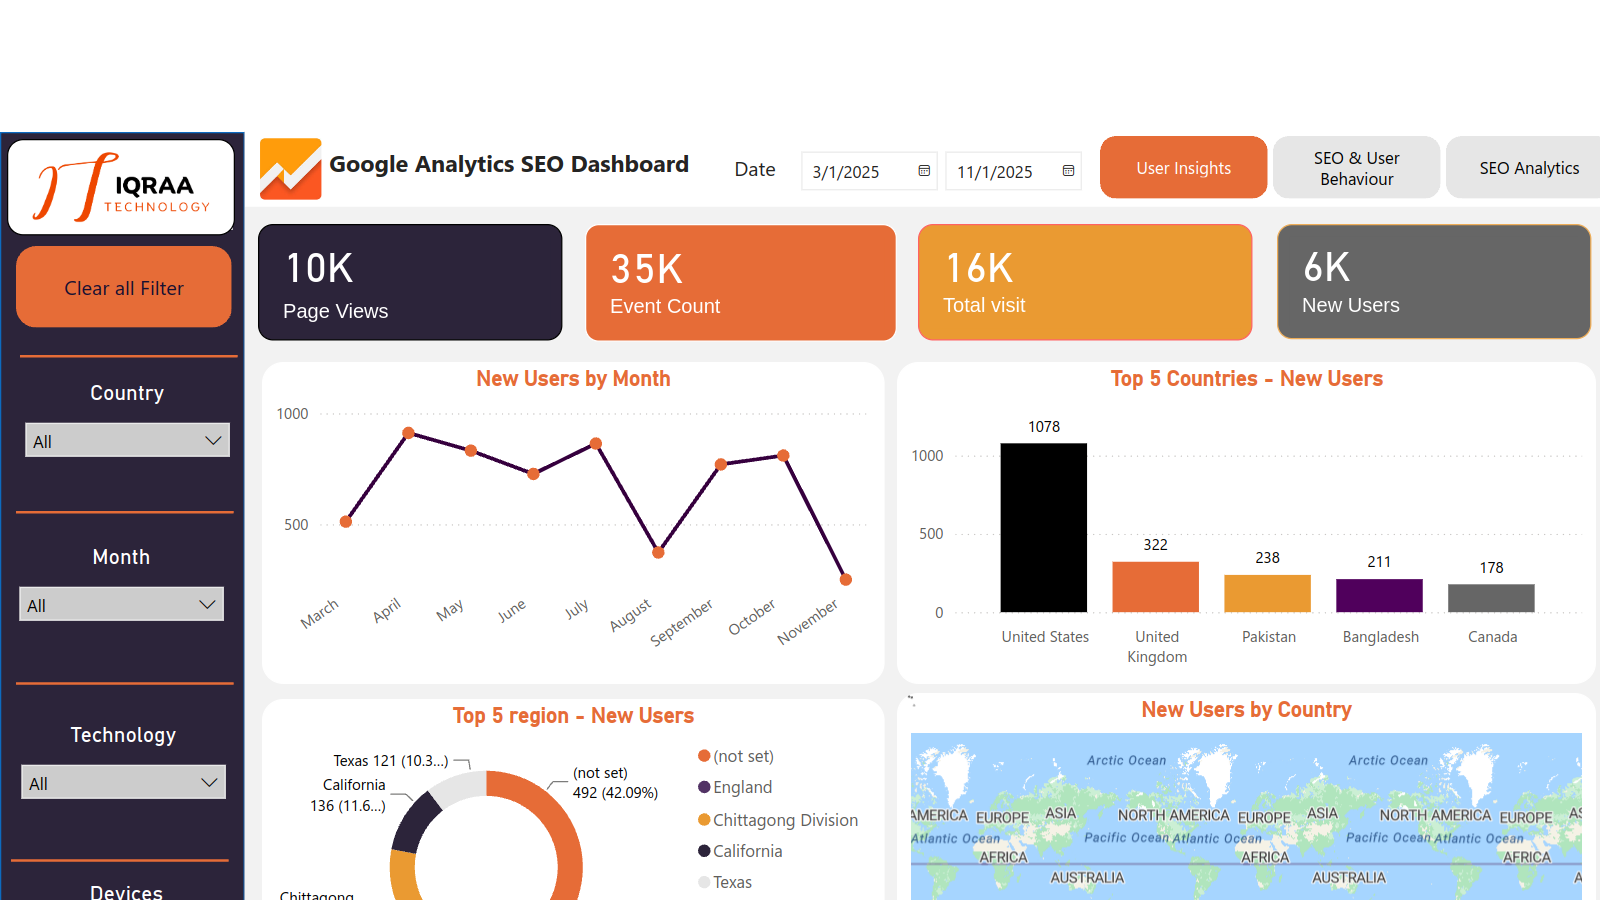
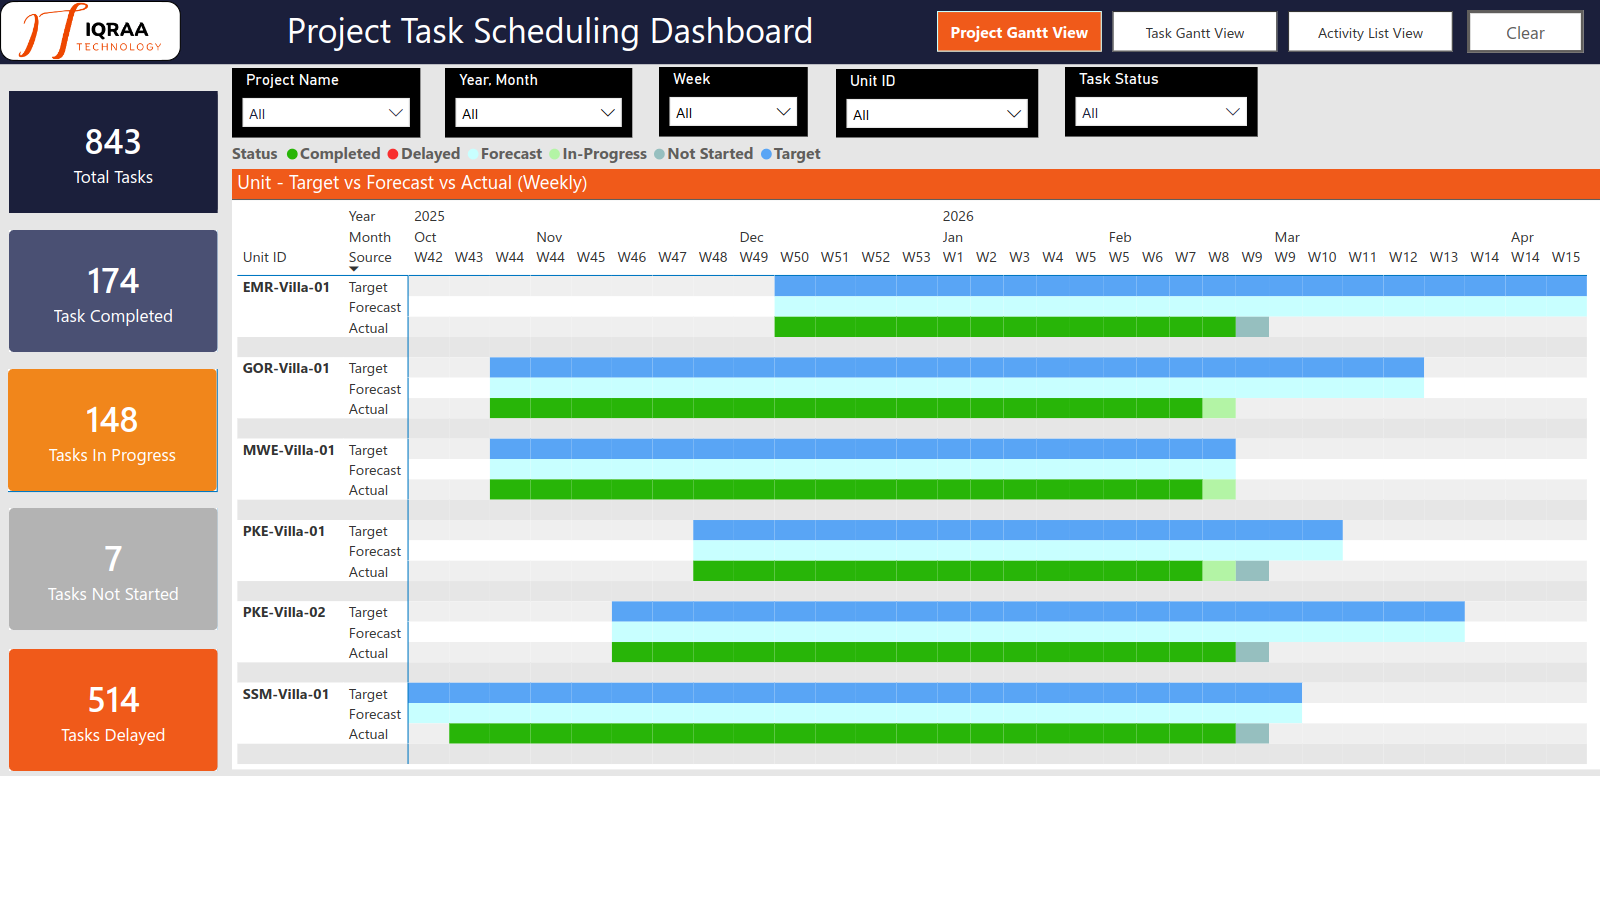
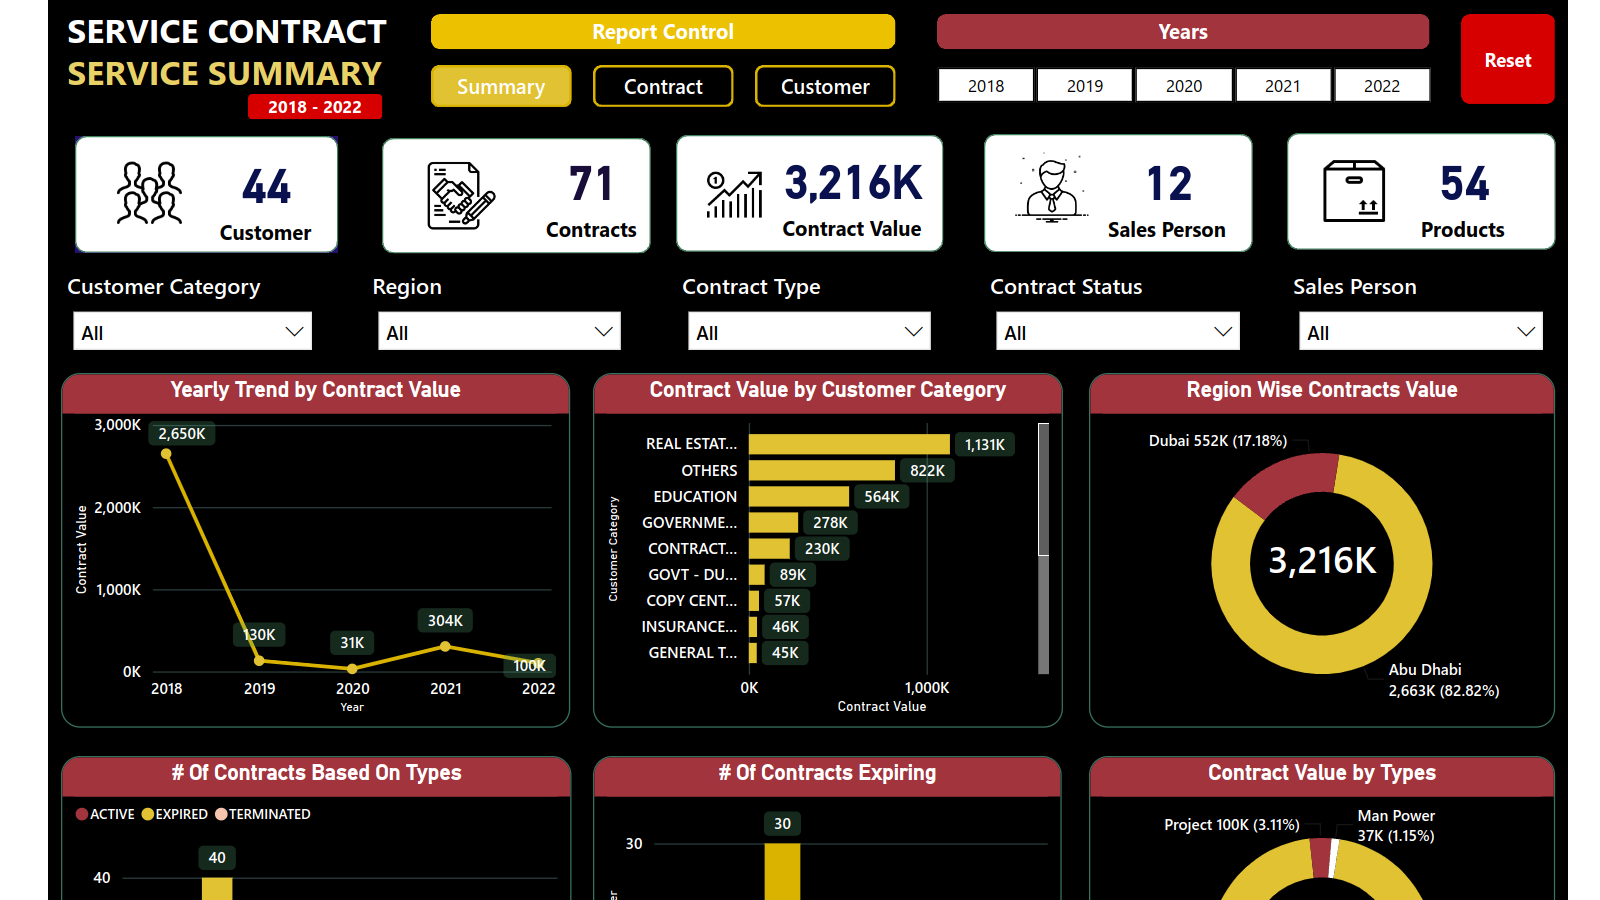
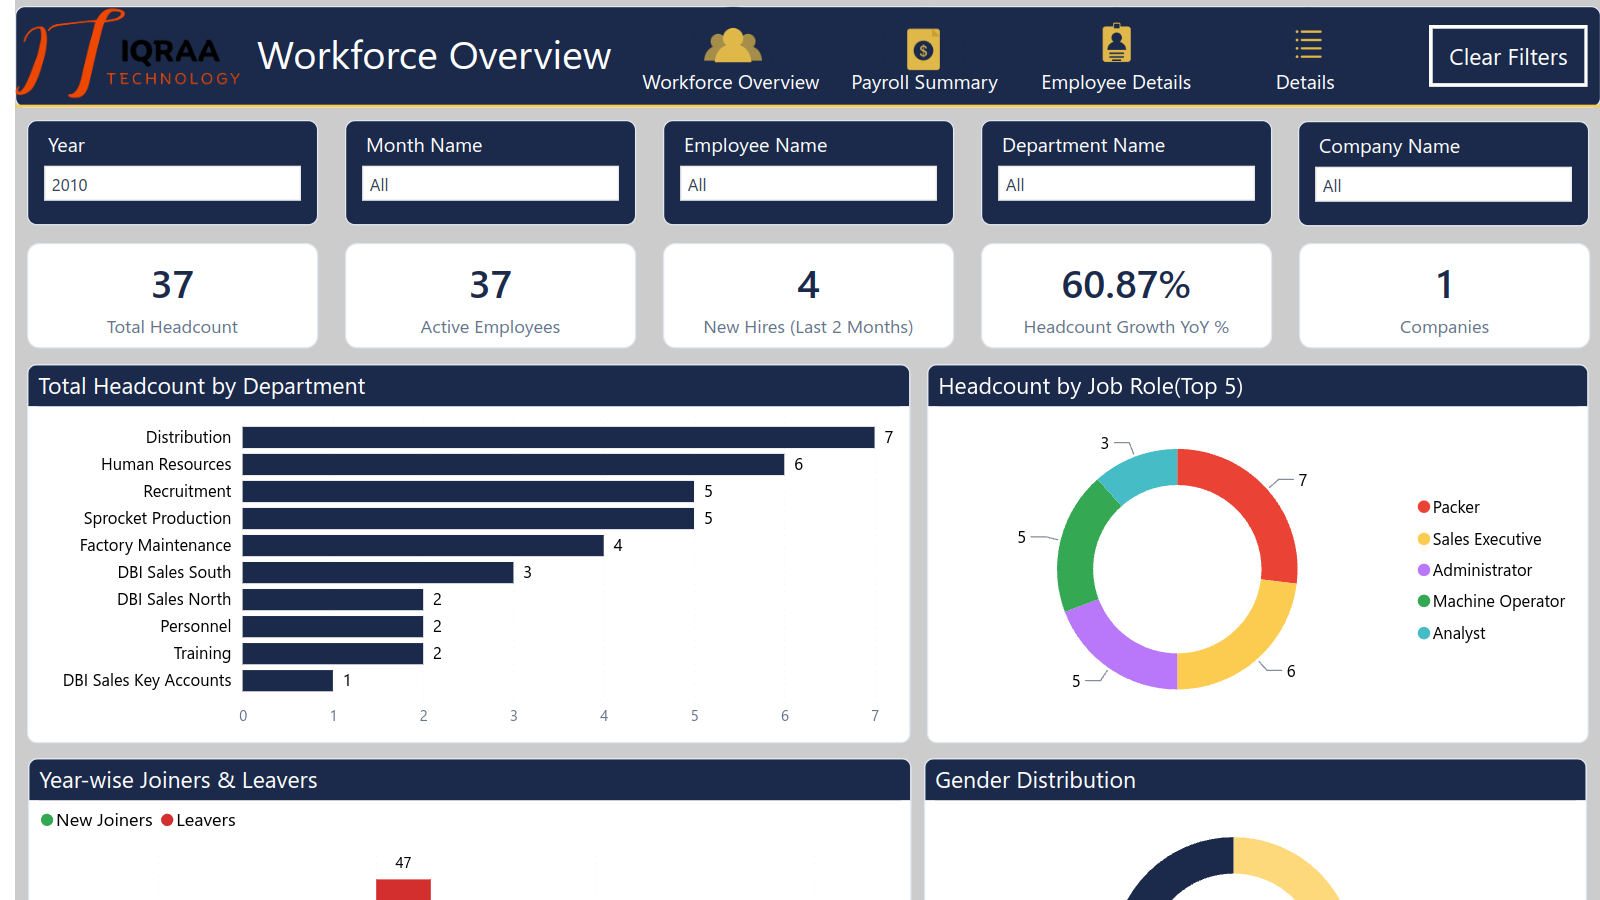
Live dashboards for finance, sales and CRM, supply chain and projects. Choose a category, then open any dashboard to view the interactive Power BI report in a new tab.
What sits behind a dashboard like this
From sample to your own reports
A production Power BI report is built on the same principles as the dashboards above.
01
One data model
A single semantic model so every visual uses the same definitions.
02
Consistent measures
KPIs such as revenue and on-time delivery written once as documented measures.
03
Filters that work together
Slicers and filters that apply across the whole report.
Power BI demo FAQ
Questions about the Power BI demo
Are these real Power BI reports?
Yes. Each dashboard card opens the original Power BI report in a new tab. A few reports ask you to sign in with a Microsoft account.
Can the live demo use our data?
Demos use sample data by default. Describe your scenario in the request and we will discuss how close to it the walkthrough can be.
Is there any obligation after a demo?
No. A demo is a conversation about whether Power BI fits your needs.
Live demo
Book a walkthrough built around your process
Tell us what you want to see and we will reply to arrange a time.
- Power BI, Power Apps or both
- Examples close to your own scenario
- Time for questions about fit, licensing and next steps
Fields marked * are required. See our Privacy Policy for how we handle your details.